New talk here!
Conservation Evidence is a splendid initiative of U.Cambridge which collates the existing evidence on species conservation, to make it easier for funders, practitioners & policy-makers to find and use.
Caroline gave this talk (video here) at its conference in January 2026. She spoke about the cycle of a project / programme, what information / evidence is needed at each stage, and specifically about how impact evaluations are only needed in specific circumstances (in which, they are very much needed).
The slides are here. References are below.
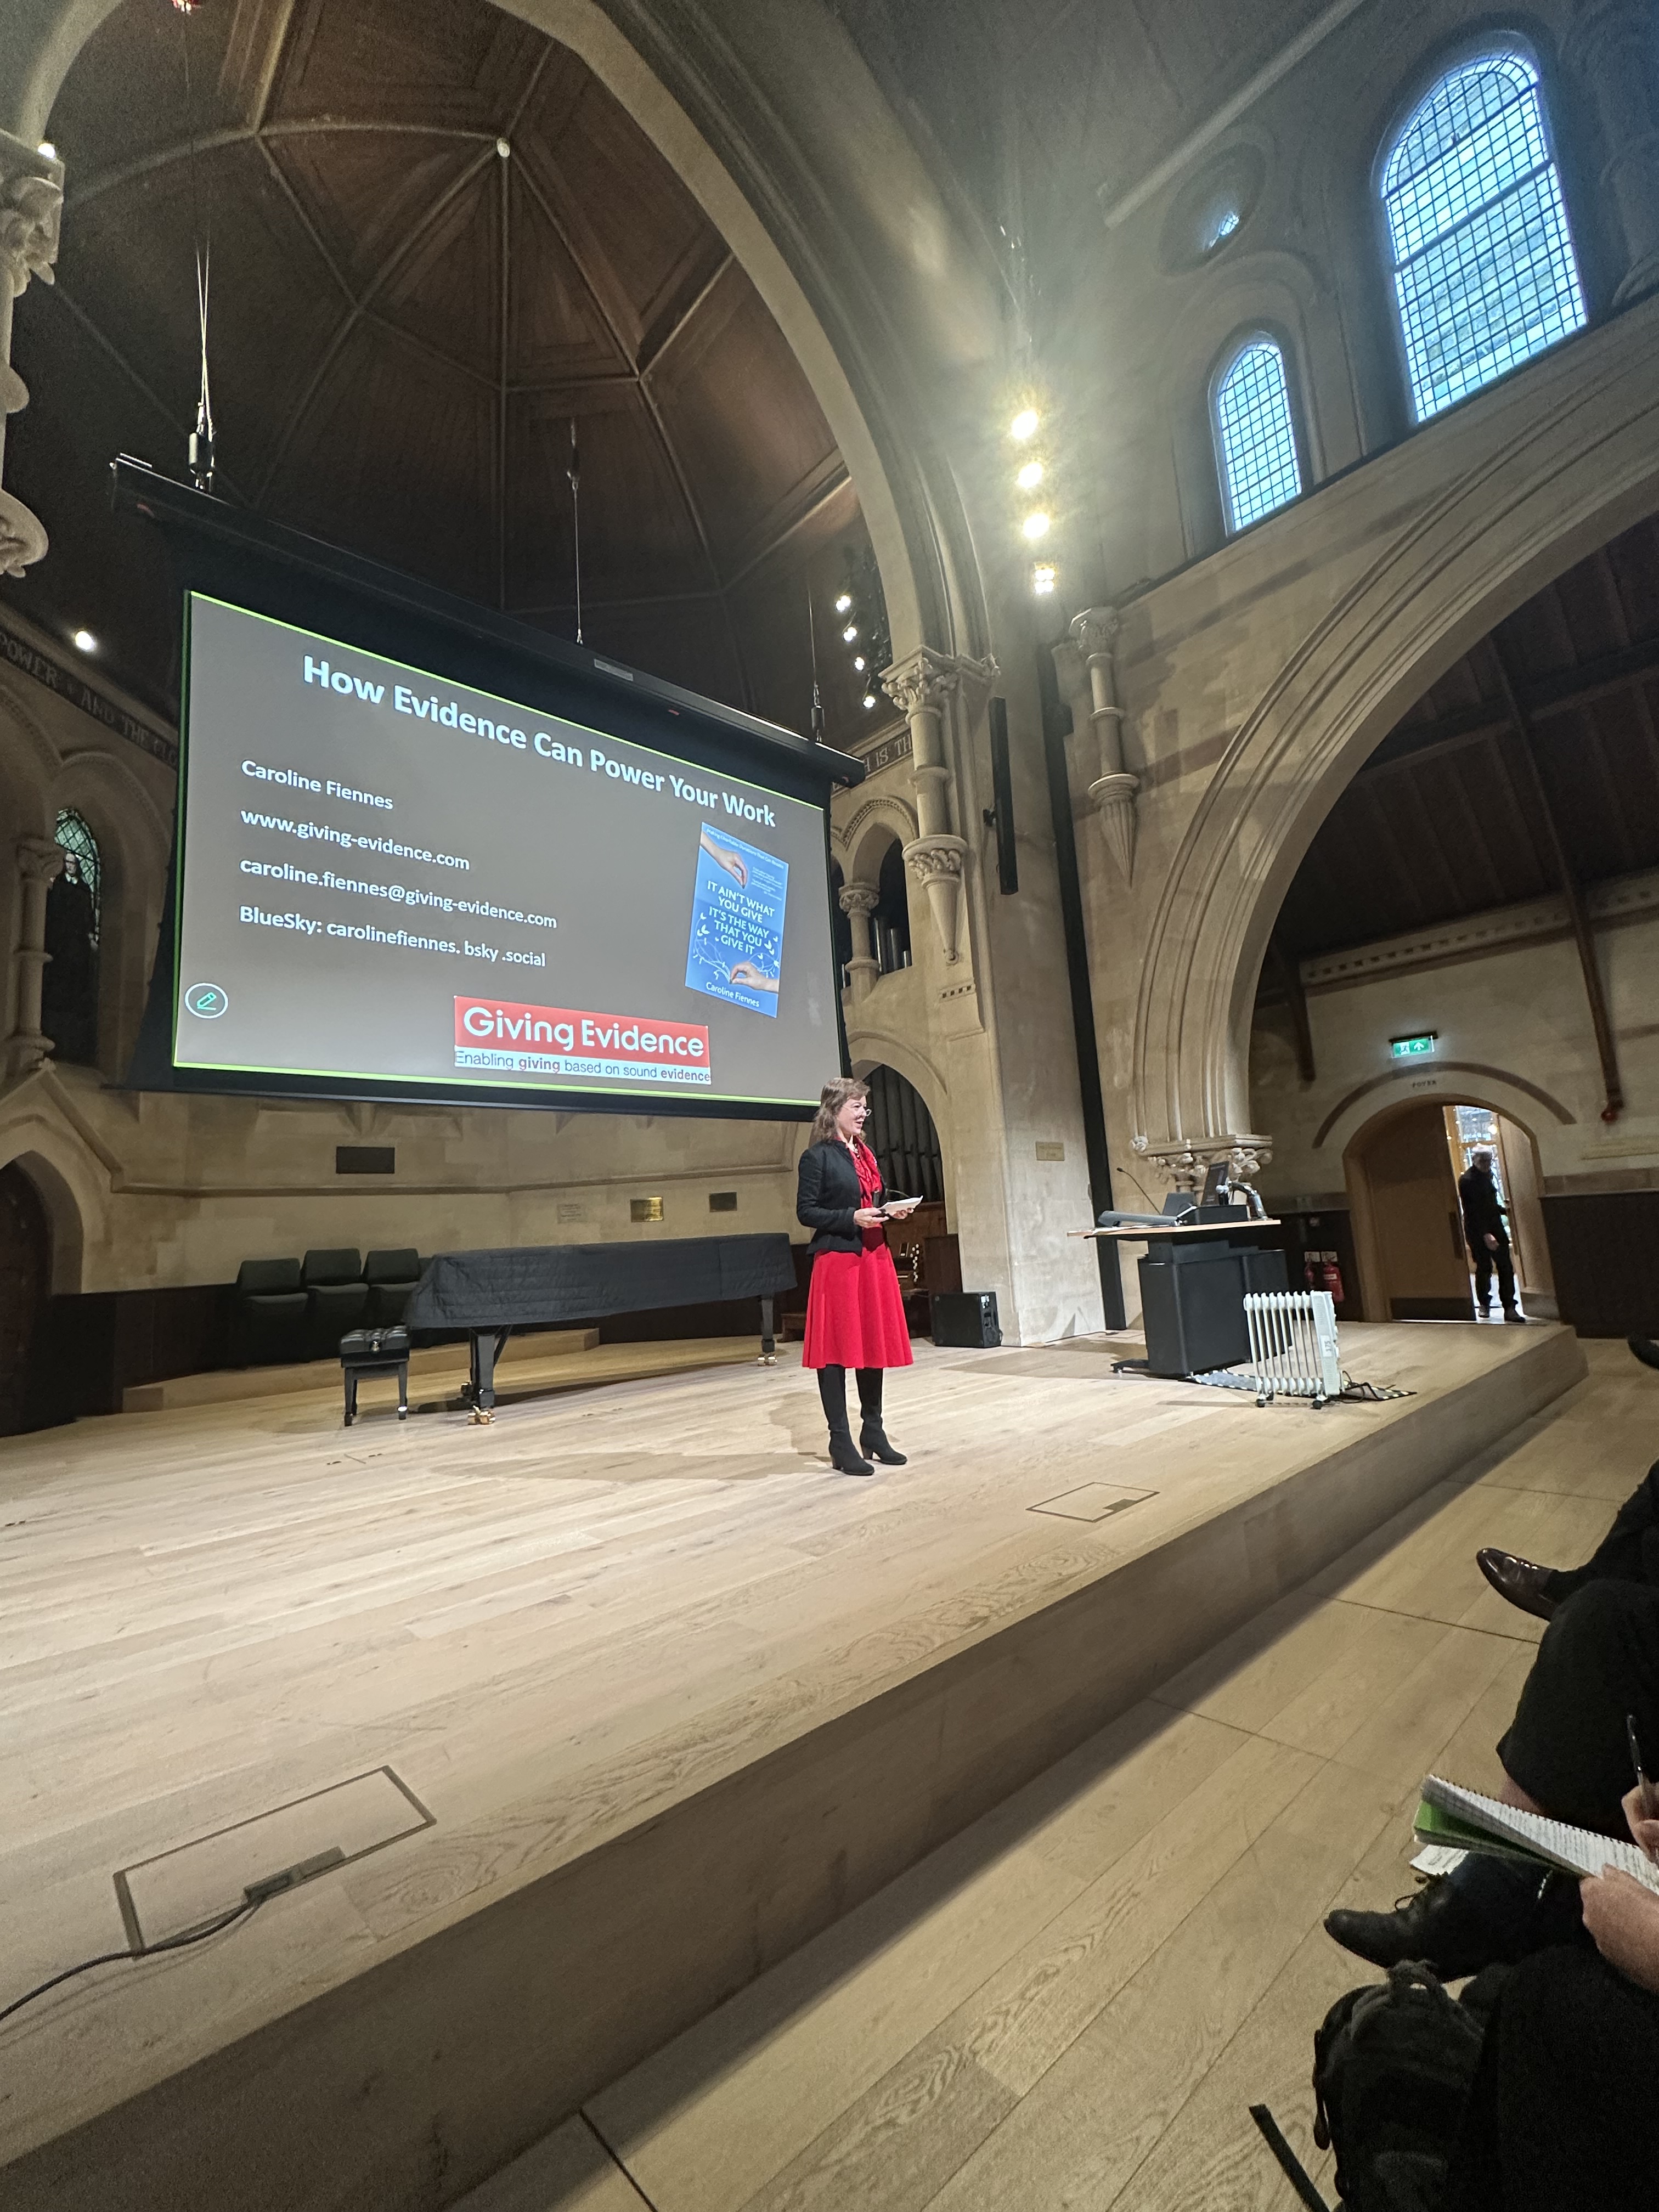
{The conf was in a re-purposed church! Very exciting. Notice the giant apse!! (curved East end where the altar would have been.)
The venue clearly isn’t expecting speakers to stand in the middle of the stage, so the camera only shows the AV table to the side. Caroline herself briefly appears in the video at ~9.11 and 10.21 – to check the time because no clock was visible from the stage!
The zoology professor who runs Conservation Evidence had previously told Caroline that creatures which are red & black are less likely to be eaten. One can never be too careful…}
The references are as follows:
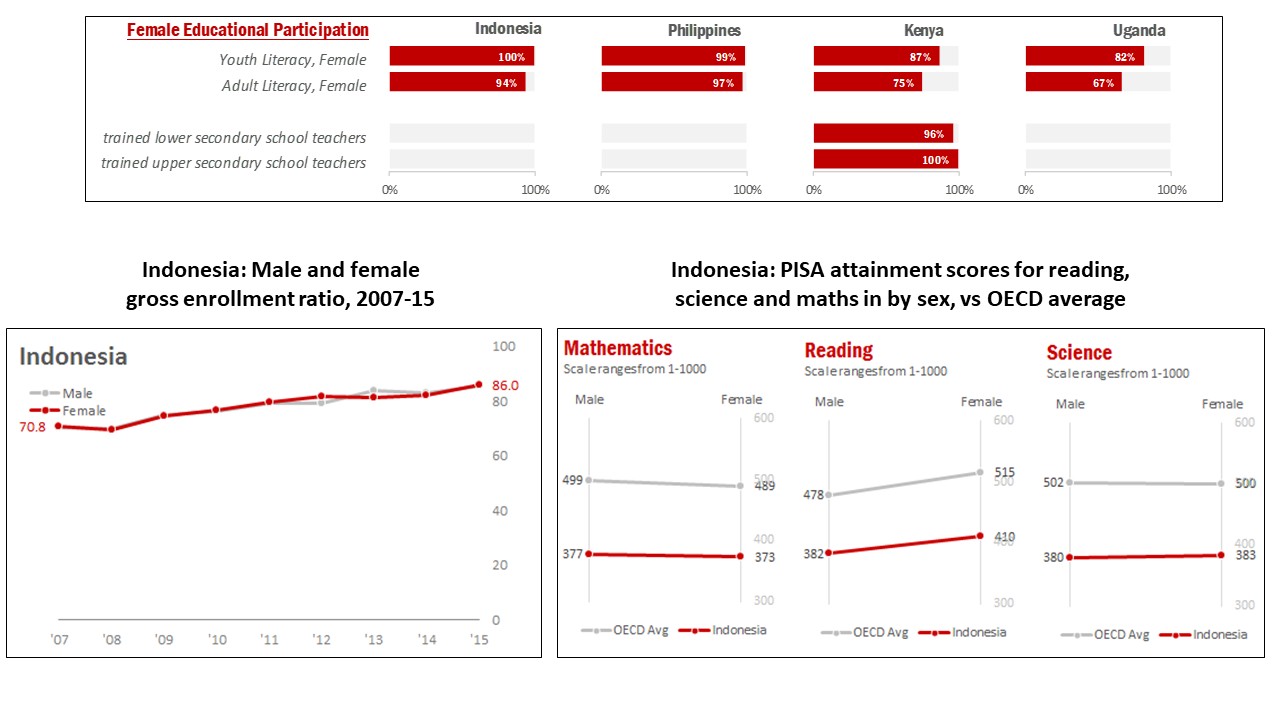
- The Indonesia education example (how girls & boys participation & attainment were about equal but both miles below the OECD average): these are from PISA data:
- Northern Bangladesh & the hungry season: see here. (Also, for completeness, here.)
- Offering incentives to parents to get their children vaccinated: see here and many other papers e.g., here.
- The large-scale education intervention in Madhya Pradesh, India, where the implementation broke down: see here. (The ARK paper was still in draft at that time but may be public by now. This is the protocol, I think.)
- Evidence & gap map about institutional responses to child abuse, as produced by Giving Evidence. As mentioned, many of the studies are in one cell – the effect of ‘good touches vs. bad touches’ programmes in schools on children’s understanding – and they all find that those programme work. See here.
- The UK Ministry of Justice Data Lab evaluations: that the sample size (no. participants) in most of the charity programmes that it had tried to evaluate was too small for results to be statistically significant: see here.
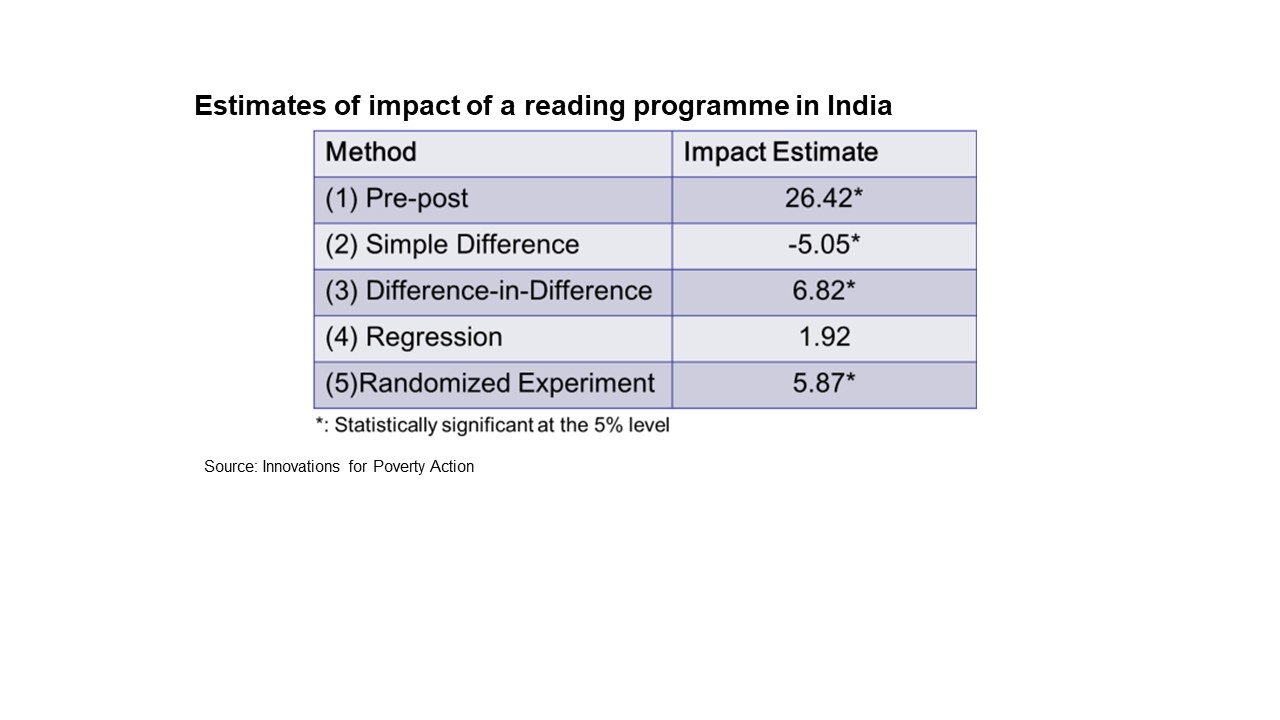
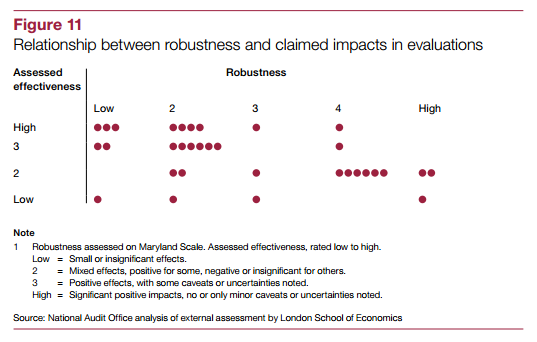
- The research method matters! Different methods can give different answers even for the effect of the same programme. See the data below about a reading programme in India. Also, the UK’s National Audit Office looked at many UK gov’t evaluations, and plotted them on the rigor of the method vs. the level of effectiveness that they found. Notice that a line of best fit goes top left to bottom right: the more rigorous methods find smaller effects:
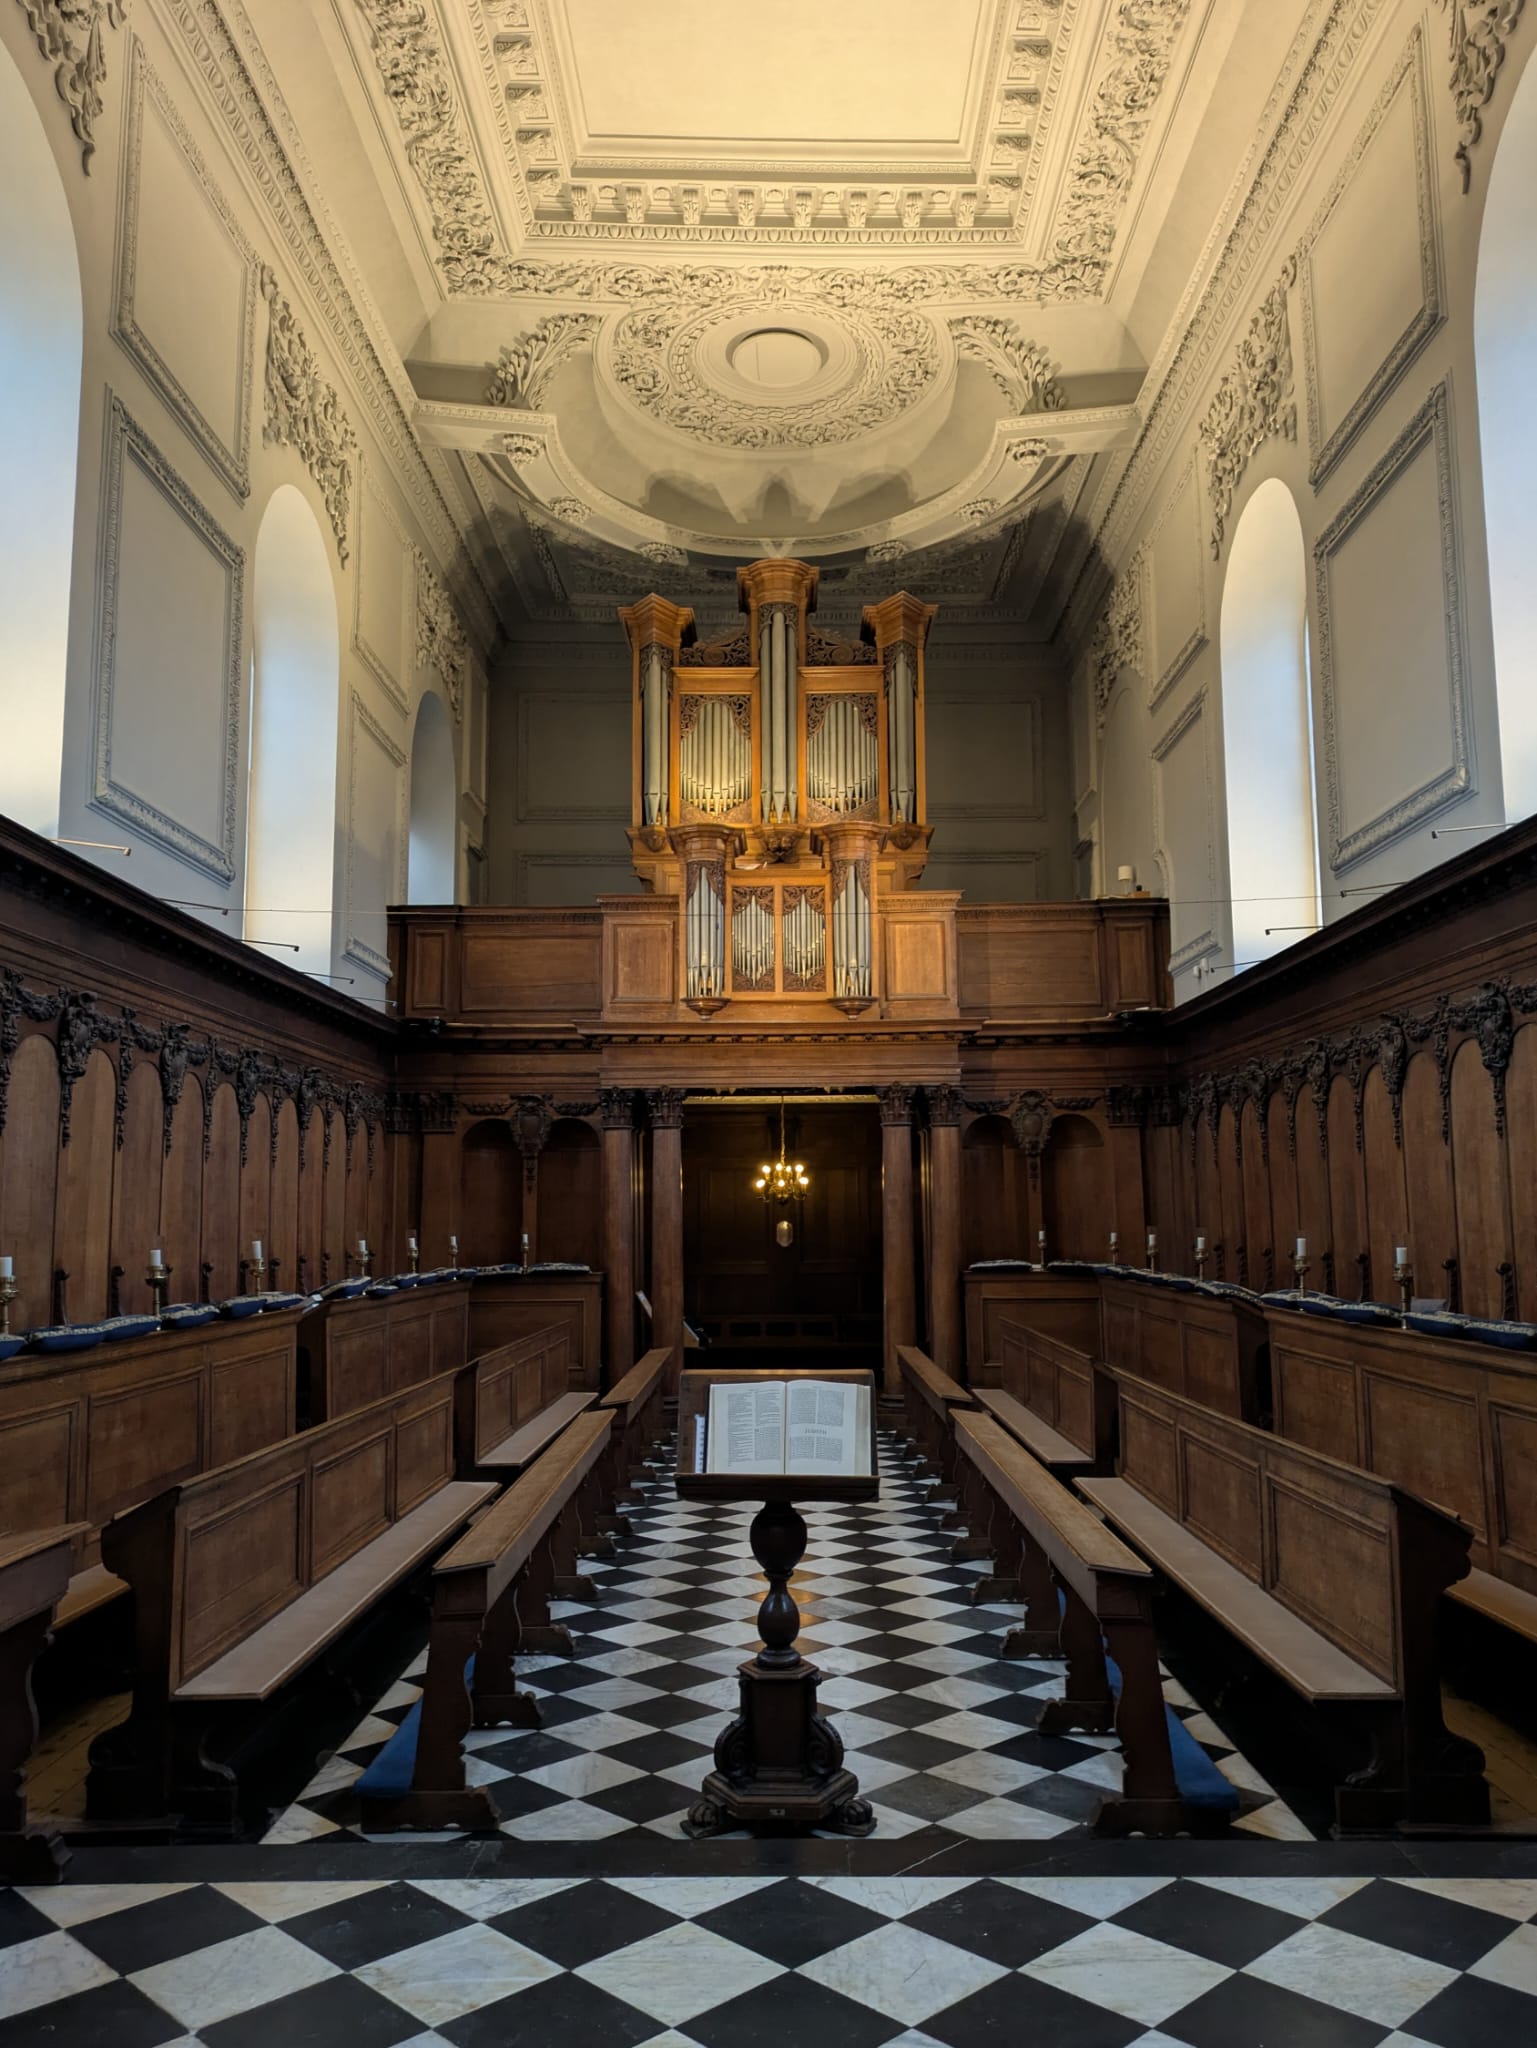
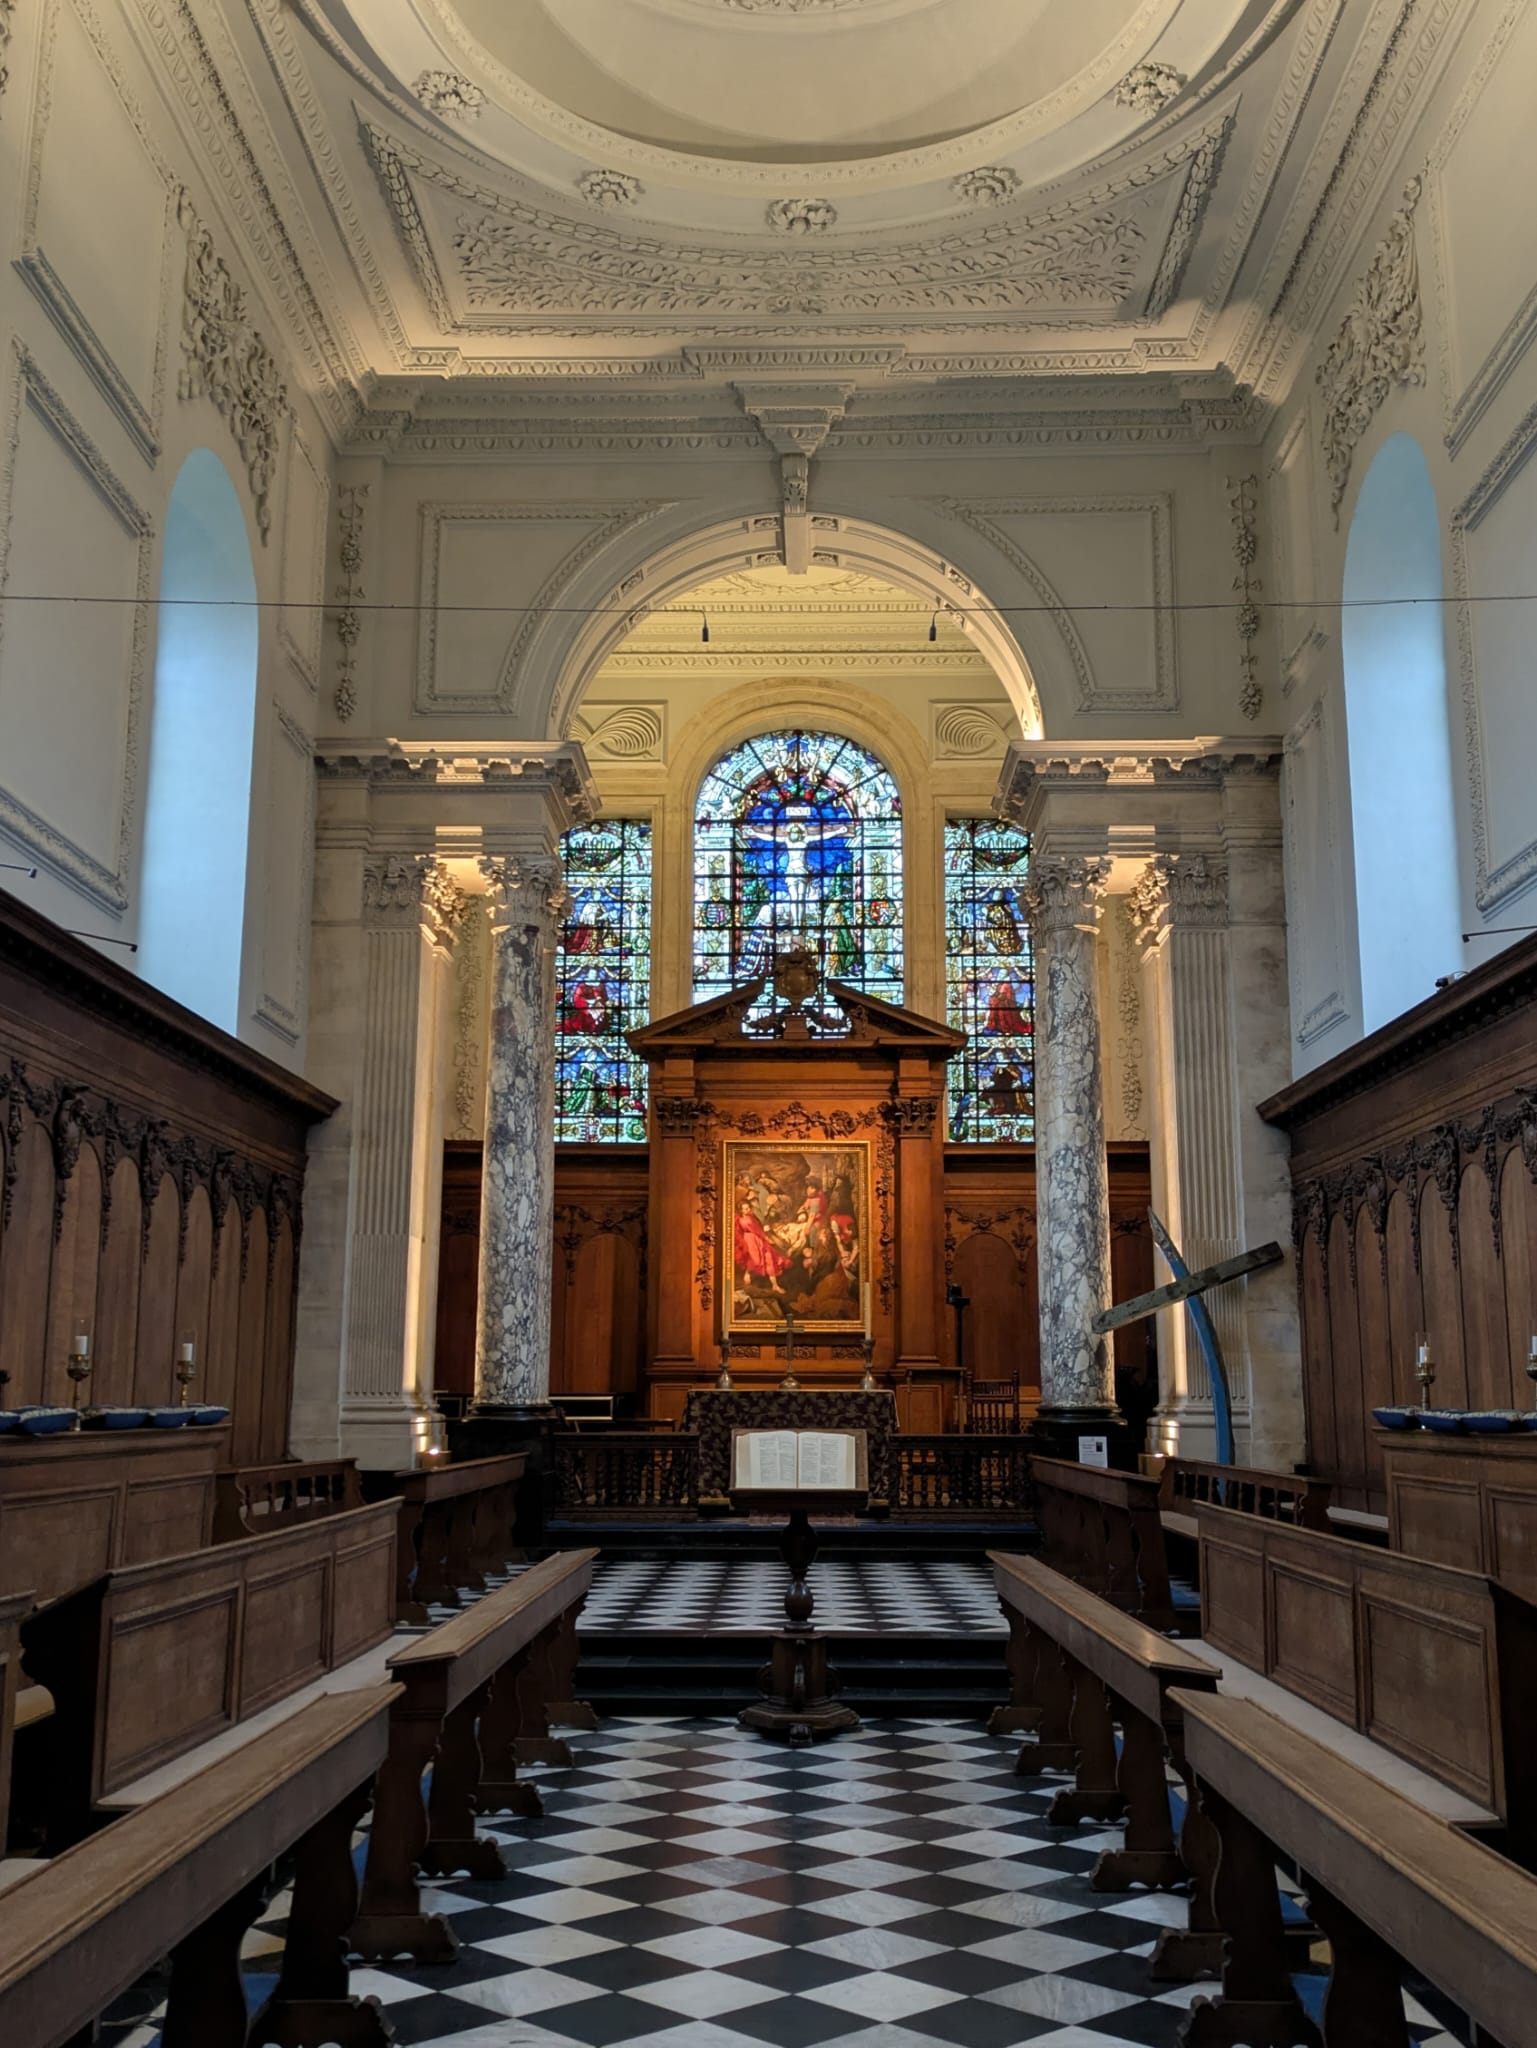
By the way, the conference was at Pembroke College Cambridge: it bought the church over the road & re-purposed it. As it happens, Pembroke’s own chapel is by Christopher Wren. His first building! See below: not bad for a beginner.
An amazing feature of that chapel is how fully-formed Wren’s style is already. It could also pass as his last building. The symmetry, proportions, Classical-ness, clever use of light & dark & perspective, columns to separate spaces, characteristic ornamentation… it’s all there, in Building No. 1.
And who commissioned this mathematician / astronomer with no architecture experience to design this building but…his uncle! Then Master of Pembroke. Wren was a nepo-baby! (He totally wasn’t. He was a Fellow of All Souls’ Oxford at age 23 🫣 But we may all be indebted to Uncle Matthew Wren!)
(You can’t see from these photos, but when I visited the chapel before the conference, the Bible happened to be open at Psalm 23… 🤩 Excellently calming.)